Simple wall#
![]()
This notebook presents a thermal circuit with capacities in every node and its state-space representation.
Introduction#
Objectives#
Model heat transfer by using a thermal network.
Obtain the mathematical model as a system of differential algebraic equations (DAE).
Find the steady-state solution.
Transform the system of DAE into state-space representation.
Find the eigenvalues and study the numerical stability.
Simulate by using Euler methods for numerical integration.
Summary#
This notebook calculates the temperature distribution in a two-layer wall in steady-state and in a dynamic simulation. The code:
Imports Python standard modules (
numpy,pandas,matplotlib.pyplot), and functions from a local module (dm4bem).Defines the physical characteristics of the materials used to construct the wall and of the air inside the room. The characteristics include thermal conductivity, density, specific heat, and width.
Creates a data frame to store information about the wall, including the materials used to construct it, and calculates the surface area of the wall and the volume of the air inside the room.
Calculates the thermal resistances and thermal capacities of the wall and the air.
Sets up the differential-algebraic system of equations (DAE) model by creating the conductance matrix, capacity matrix, arc-node incidence matrix, and input vectors.
Solves the DAE model to determine the steady-state temperature distribution in the wall when the outdoor temperature is 1 °C and when the heat input is 1 W. It then calculates the indoor temperature based on the results of the DAE model.
Converts the DAE model to a state-space representation and calculates the eigenvalues of the state matrix.
Calculates the maximum time step that can be used to solve the state-space model and the settling time.
Integrates in time the state-space model by using Euler explicit and implicit methods. The results are plotted for step-response and for response to the outdoor temperature.
import numpy as np
import pandas as pd
import matplotlib.pyplot as plt

import dm4bem
Modelling#
Wall description#
Let’s consider the heat transfer through a plane wall which separates the outside air, at temperature \(T_o\), from the inside air. Heat flow rate \(\dot{Q}_h\) is added to the inside air by a fan-coil (see Figure 1).

Figure 1. Plane wall and its thermal network model. The concrete (layer 1) is divided in four meshes and the insulation (layer 2) in two.
The wall is composed of two materials (concrete and insulation), characterized by their thermal properties.
concrete = {'Conductivity': 1.400,      # W/(m·K)
            'Density': 2300.0,          # kg/m³
            'Specific heat': 880,       # J/(kg⋅K)
            'Width': 0.2}               # m

insulation = {'Conductivity': 0.040,    # W/(m·K)
              'Density': 16.0,          # kg/m³
              'Specific heat': 1210,    # J/(kg⋅K)
              'Width': 0.08}            # m

wall = pd.DataFrame.from_dict({'Layer_1': concrete,
                               'Layer_2': insulation},
                              orient='index')
wall
| Conductivity | Density | Specific heat | Width | |
|---|---|---|---|---|
| Layer_1 | 1.40 | 2300.0 | 880 | 0.20 |
| Layer_2 | 0.04 | 16.0 | 1210 | 0.08 |
air = {'Density': 1.2,                 # kg/m³
       'Specific heat': 1000}          # J/(kg⋅K)

pd.DataFrame(air, index=['Air'])
| Density | Specific heat | |
|---|---|---|
| Air | 1.2 | 1000 |
We’ll consider constant convection coefficients, in W/(m²·K), for the indoor and the outdoor surfaces.
# convection coefficients, W/(m²·K)
h = pd.DataFrame([{'in': 4., 'out': 10.}], index=['h'])
h
| in | out | |
|---|---|---|
| h | 4.0 | 10.0 |
Let’s consider that the surface area of the wall is 3 x 3 m² and the volume of the indoor air is 3 x 3 x 3 m³.
S_wall = 3 * 3      # m², wall surface area
V_air = 3 * 3 * 3   # m³, indoor air volume
Thermal network model#
The wall consists of two layers: concrete and insulation. The first layer is discretized in 4 meshes and the second layer in 2 meshes. By adding together the resistances which are in series, a simpler thermal network is obtained (Figue 2).

Figure 2. Thermal network model of a simple wall obtained from Figure 1 by using the equivalent of the resistances in series. This model contains capacities in every node.
The circuit (or the network) is an weighted directed graph composed of:
oriented branches: temperature sources and resistances (or conductances) through which a flow rate crosses;
nodes: flow rate sources and capacities characterized by a temperature;
incidence relation: description of how the nodes are connected by the oriented branches.
The circuit (or the network) is described by:
elements: resistances (or conductances) and capacities;
sources: temperatures and heat flow rates;
connections: an oriented graph which shows how the nodes of temperature are connected by oriented branches of flow rates.
Network (or circuit) analysis means finding the temperatures and the flow rates when the circuit (i.e. the elements, the sources and their connections) is given.
The circuit elements of the thermal network are the resistances and the capacities. Their values are found by using the thermo-physical properties of the materials: thermal conductivity, specific heat capacity and density, and the geometrical values: width, surface area and volume.
The parameters are grouped in matrices of parameters, or coefficient matrices, and the variables are in vectors. The variables are:
physical inputs, modelled by temperature and flow rate sources;
physical outputs, modelled by temperatures of the nodes and flow rates through the branches.
The thermal circuits model physical systems which are causal: the values of the outputs depend on past and current values of the inputs (but not on future values of the inputs).
Parameters of thermal network#
Resistances#
The thermal resistances for thermal conduction are of the form:
where:
\(w\) is the width of the material, m;
\(\lambda\) - thermal conductivity of the material, W/(m·K);
\(S\) - surface area of the wall, m².
# conduction
R_cd = wall['Width'] / (wall['Conductivity'] * S_wall)  # K/W
The thermal resistances for convection are of the form:
where:
\(h\) is the convection coefficient, W/(m² K);
\(S\) - surface area of the wall, m².
# convection
R_cv = 1 / (h * S_wall)     # K/W
Capacities#
The thermal capacities of the wall are of the form:
where:
\(m_w = \rho_w w_w S_w\) is the mass of the material of the wall, kg;
\(c_w\) - specific heat capacity of the material, J/(kg⋅K);
\(\rho_w\) - density of the material, kg/m³;
\(w_w\) - width of the wall, m;
\(S_w\) - surface area of the wall, m².
C_wall = wall['Density'] * wall['Specific heat'] * wall['Width'] * S_wall
The thermal capacity of the air is:
where:
\(m_a = \rho_a V_a\) is the mass of the air, kg;
\(\rho_w\) - density of air, kg/m³;
\(c_a\) - specific heat capacity of the air, J/(kg⋅K);
\(V_a\) - volume of the air in the thermal zone, m³.
C_air = air['Density'] * air['Specific heat'] * V_air
Differential algebraic equations (DAE)#
The number of temperature nodes, \(n_{\theta}\), and the nmber of flow branches, \(n_q\), of the thermal network depend on the number of meshes obtained by the discretization of the wall.
# number of temperature nodes and flow branches
no_θ = no_q = 7

θ = ['θ0', 'θ1', 'θ2', 'θ3', 'θ4', 'θ5', 'θ6']  # temperature nodes
q = ['q0', 'q1', 'q2', 'q3', 'q4', 'q5', 'q6']  # flow-rate branches
Conductance matrix \(G\)#
The resistances are grouped in the conductance matrix, which is diagonal:
where:
\(n_q\) is the number of flow rate branches, \(n_q = 7\);
\(R_0 = R_{cv,out} + R_{cd,c} / 8\) ; this resistance is composed of outdoor convection, \(R_{cv,out}\), and conduction in 1/8th of the concrete width, \(R_{cd,c} / 8\); since the concrete is discretized in 4 meshes, there are 8 resistances, each one of value \(R_{cd,c} / 8\);
\(R_1 = R_2 = R_3 = R_{cd,c} / 8 + R_{cd,c} / 8 = R_{cd,c} / 4\); two resistances \(R_{cd,c} / 8\) are added, resulting in \(R_{cd,c} / 4\);
\(R_4 = R_{cd,c} / 8 + R_{cd,i} / 4\); this resistance is formed by a slice of concrete, \(R_{cd,c} / 8\), and a slice of insulation, \(R_{cd,i} / 4\);
\(R_5 = R_{cd,i} / 4 + R_{cd,i} / 4 = R_{cd,i} / 2\); two meshes of insulation, each one with resistance \(R_{cd,i} / 4\), are in series;
\(R_6 = R_{cd,i} / 4 + R_{cv,in}\); this resistance is composed of conduction in the insulation,\(R_{cd,i} / 4\), and convection at the inside surface of the wall, \(R_{cv,in}\).
Note: A branch consists of a temperature source and a thermal resistance (or conductance). Each branch of the network needs to have a resistance (or a conductance) but not necessarily a source of temperature.
# convert R_cv from DataFrame into Series
R_cv = pd.Series(R_cv.values.flatten(), index=R_cv.columns)
# Conductance matrix
R = np.zeros([no_q])
R[0] = R_cv['out'] + R_cd['Layer_1'] / 8
R[1] = R[2] = R[3] = R_cd['Layer_1'] / 4
R[4] = R_cd['Layer_1'] / 8 + R_cd['Layer_2'] / 4
R[5] = R_cd['Layer_2'] / 2
R[6] = R_cd['Layer_2'] / 4 + R_cv['in']
G = np.diag(np.reciprocal(R))
Capacity matrix \(C\)#
The capacities are grouped in the capacity matrix, which is diagonal:
where:
\(n_θ\) is the number of temperature nodes, \(n_θ = 7\);
\(C_0 = C_1 = C_2 = C_3 = C_{w, concrete} / 4\); since the concrete layer is divided in 4 meshes, the capacity of a slice is 1/4th of the capacity of the concrete layer;
\(C_4 = C_5 = C_{w, insulation} / 2\); since the insulation layer is divided in 2 meshes, the capacity of a slice is 1/2 of the capacity of the insulation layer;
\(C_6 = C_{a}\), the capacity of the indoor air.
Note: Not every temperature node needs to have a capacity. The capacity of a surface is zero, since its mass is zero (because its volume is zero).
# Capacity matrix
C = np.zeros(no_θ)
C[0] = C[1] = C[2] = C[3] = C_wall['Layer_1'] / 4
C[4] = C[5] = C_wall['Layer_2'] / 2
C[6] = C_air
C = np.diag(C)
Arc-node incidence matrix \(A\)#
The incidence matrix shows the relation between oriented branches (i.e. flow rates) and nodes (i.e. temperatures). The rows in the incidence matrix \(A\) correspond to the branches containing the heat flow rates \(q_k\) across the resistances \(R_k\) and the columns correspond to the temperature nodes \(\theta_l\). In the row corresponding to the branch \(q_k\) in the position of the node \(\theta_l\) there is -1 if the flow \(q_k\) leaves the node, +1 if the flow \(q_k\) enters into the node \(\theta_k\) and 0 if the resistance \(R_k\) is not connected to the temperature node \(\theta_k\) (Ghiaus, 2013):
The matrix \(-A\) is a difference operator for the vector \(\theta\) of temperatures, \(-A \equiv \Delta\). That is, \(e = -A \theta\) or \(e = \Delta \theta\) is the vector of differences between temperature nodes connected by oriented flow rates (Ghiaus, 2013).
# Arc-node incidence matrix
A = np.eye(no_q, no_θ + 1)
A = -np.diff(A, n=1, axis=1)
pd.DataFrame(A, index=q, columns=θ)
| θ0 | θ1 | θ2 | θ3 | θ4 | θ5 | θ6 | |
|---|---|---|---|---|---|---|---|
| q0 | 1.0 | -0.0 | -0.0 | -0.0 | -0.0 | -0.0 | -0.0 |
| q1 | -1.0 | 1.0 | -0.0 | -0.0 | -0.0 | -0.0 | -0.0 |
| q2 | -0.0 | -1.0 | 1.0 | -0.0 | -0.0 | -0.0 | -0.0 |
| q3 | -0.0 | -0.0 | -1.0 | 1.0 | -0.0 | -0.0 | -0.0 |
| q4 | -0.0 | -0.0 | -0.0 | -1.0 | 1.0 | -0.0 | -0.0 |
| q5 | -0.0 | -0.0 | -0.0 | -0.0 | -1.0 | 1.0 | -0.0 |
| q6 | -0.0 | -0.0 | -0.0 | -0.0 | -0.0 | -1.0 | 1.0 |
Vectors of temperature sources \(b\) and flow rate sources \(f\)#
First, we will set all the temperature sources \(b\) and flow sources \(f\) to zero.
# Input vectors
b = np.zeros(no_q)  # temperatures
f = np.zeros(no_θ)  # flow rates
Their values will be changed depending on the conditions.
System of differential algebraic equations#
The system of Differential-Algebraic Equations (DAE) is (Ghiaus, 2013):
or
which contains the matrices and vectors characterizing the circuit:
elements: conductances \(G\) and capacities \(C\);
sources: temperatures \(b\) and heat flow rates \(f\);
connections: incidence matrix \(A\) which shows how the nodes of temperature are connected by oriented branches of flow rates. Matrix \(\Delta \equiv -A\) operates differences between the temperatures over the branches and matrix \(\Sigma \equiv A^T\) operates sum of heat flow rates in the nodes.
Steady-state solution#
In steady-state, i.e., \(\dot{\theta} = 0\), the solution of the system of Differential-Algebraic Equations (DAE) is:
Let’s consider two steady-states:
The outdoor temperature is \(T_o = 1\, \mathrm{^\circ C}\), i.e. \(b_0 = 1\) and all other sources are zero.
The indoor flow introduced by the fan-coil is \(\dot{Q}_h = 1\, \mathrm{W}\), i.e. \(f_6 \equiv f_{end} = 1\) and all other sources are zero.
Response to outdoor temperature variation#
The outdoor temperature is \(T_o = 1\, \mathrm{^\circ C}\), i.e. \(b_0 = 1\).
b[0] = 1
θ_steady_To = np.linalg.inv(A.T @ G @ A) @ (A.T @ G @ b + f)

np.set_printoptions(precision=3)
print('When To = 1°C, the temperatures in steady-state are:', θ_steady_To, '°C')
print(f'The indoor temperature is: {θ_steady_To[-1]:.3f} °C')
When To = 1°C, the temperatures in steady-state are: [1. 1. 1. 1. 1. 1. 1.] °C
The indoor temperature is: 1.000 °C
Response to indoor flow rate variation#
The indoor flow introduced by the fan-coil is \(\dot{Q}_h = 1\, \mathrm{W}\), i.e. \(f_6 \equiv f_{end} = 1\).
b[0] = 0
f[-1] = 1
θ_steady_Qh = np.linalg.inv(A.T @ G @ A) @ (A.T @ G @ b + f)

print('When Qh = 1W, the temperatures in steady-state are:', θ_steady_Qh, '°C')
print(f'The indoor temperature is: {θ_steady_Qh[-1]:.3f} °C')
When Qh = 1W, the temperatures in steady-state are: [0.013 0.017 0.021 0.025 0.083 0.194 0.277] °C
The indoor temperature is: 0.277 °C
State-space representation#
If matrix \(C\) is invertible (or non-singular), then the system of Differential-Algebraic Equations (DAE)
can be put in state-space representation
where:
\(\theta\) is the state vector of temperatures;
\(u = \begin{bmatrix} b \\ f\end{bmatrix}\) - vector of inputs (temperature sources \(b\) and flow sources \(f\));
\(A_s = -C^{-1} A^T G A\) - state matrix, \(\dim A = n_\theta \times n_\theta\);
\(B_s = C^{-1}\begin{bmatrix} A^T G & I \end{bmatrix}\) - input matrix, \(\dim B = n_\theta \times n_u\);
\(C_s = \begin{bmatrix} 0 & 0 & ... &1 \end{bmatrix}\) - output matrix, \(\dim C = 1 \times n_\theta\) if the output is the temperature in node 6, \(y = \theta_6\);
\(D_s = \begin{bmatrix} 0 & 0 & ... &0 \end{bmatrix}\) - feedthrough (or feedforward matrix, \(\dim D = 1 \times n_u\).
The first equation, \( \dot{\theta}=A_s \theta + B_s u \), is called state or system equation and the second equation, \( y = C_s \theta + D_s u \), is called observation equation.
The state matrix is \(A_s = -C^{-1} A^T G A\).
# State matrix
As = -np.linalg.inv(C) @ A.T @ G @ A
# pd.set_option('precision', 1)
pd.DataFrame(As, index=θ, columns=θ)
| θ0 | θ1 | θ2 | θ3 | θ4 | θ5 | θ6 | |
|---|---|---|---|---|---|---|---|
| θ0 | -0.000361 | 0.000277 | 0.000000 | 0.000000 | 0.000000 | 0.000000 | 0.000000 |
| θ1 | 0.000277 | -0.000553 | 0.000277 | 0.000000 | 0.000000 | 0.000000 | 0.000000 |
| θ2 | 0.000000 | 0.000277 | -0.000553 | 0.000277 | 0.000000 | 0.000000 | 0.000000 |
| θ3 | 0.000000 | 0.000000 | 0.000277 | -0.000296 | 0.000019 | 0.000000 | 0.000000 |
| θ4 | 0.000000 | 0.000000 | 0.000000 | 0.002494 | -0.003785 | 0.001291 | 0.000000 |
| θ5 | 0.000000 | 0.000000 | 0.000000 | 0.000000 | 0.001291 | -0.003013 | 0.001722 |
| θ6 | 0.000000 | 0.000000 | 0.000000 | 0.000000 | 0.000000 | 0.000370 | -0.000370 |
The input matrix is \(B_s = C^{-1}\begin{bmatrix} A^T G & I \end{bmatrix}\).
# Input matrix
Bs = np.linalg.inv(C) @ np.block([A.T @ G, np.eye(no_θ)])
# pd.set_option('precision', 2)
pd.DataFrame(Bs, index=θ, columns=q + θ)
| q0 | q1 | q2 | q3 | q4 | q5 | q6 | θ0 | θ1 | θ2 | θ3 | θ4 | θ5 | θ6 | |
|---|---|---|---|---|---|---|---|---|---|---|---|---|---|---|
| θ0 | 0.000084 | -0.000277 | 0.000000 | 0.000000 | 0.000000 | 0.000000 | 0.000000 | 0.000001 | 0.000000 | 0.000000 | 0.000000 | 0.000000 | 0.000000 | 0.000000 |
| θ1 | 0.000000 | 0.000277 | -0.000277 | 0.000000 | 0.000000 | 0.000000 | 0.000000 | 0.000000 | 0.000001 | 0.000000 | 0.000000 | 0.000000 | 0.000000 | 0.000000 |
| θ2 | 0.000000 | 0.000000 | 0.000277 | -0.000277 | 0.000000 | 0.000000 | 0.000000 | 0.000000 | 0.000000 | 0.000001 | 0.000000 | 0.000000 | 0.000000 | 0.000000 |
| θ3 | 0.000000 | 0.000000 | 0.000000 | 0.000277 | -0.000019 | 0.000000 | 0.000000 | 0.000000 | 0.000000 | 0.000000 | 0.000001 | 0.000000 | 0.000000 | 0.000000 |
| θ4 | 0.000000 | 0.000000 | 0.000000 | 0.000000 | 0.002494 | -0.001291 | 0.000000 | 0.000000 | 0.000000 | 0.000000 | 0.000000 | 0.000143 | 0.000000 | 0.000000 |
| θ5 | 0.000000 | 0.000000 | 0.000000 | 0.000000 | 0.000000 | 0.001291 | -0.001722 | 0.000000 | 0.000000 | 0.000000 | 0.000000 | 0.000000 | 0.000143 | 0.000000 |
| θ6 | 0.000000 | 0.000000 | 0.000000 | 0.000000 | 0.000000 | 0.000000 | 0.000370 | 0.000000 | 0.000000 | 0.000000 | 0.000000 | 0.000000 | 0.000000 | 0.000031 |
The input vector is formed by stacking the vector of temperature sources \(b\) and the vector of flow sources \(f\):
However, many sources in the model are zero. For our example, there are only two sources: \(T_o\) and \(\dot{Q}_h\). Therefore,
and
Since the sources that are identically zero have no influence on the outputs, they can be eliminated from the input vector, which becomes:
that is, only the columns that correspond to non-identically zero sources, i.e., the 1st and the last columns, are kept in matrix \(B_s\).
# Select columns for which the input vector is not zero
# 1st column for To and last column for Qh
Bs = Bs[:, [0, -1]]
pd.DataFrame(Bs, columns=['To', 'Qh'])
| To | Qh | |
|---|---|---|
| 0 | 0.000084 | 0.000000 |
| 1 | 0.000000 | 0.000000 |
| 2 | 0.000000 | 0.000000 |
| 3 | 0.000000 | 0.000000 |
| 4 | 0.000000 | 0.000000 |
| 5 | 0.000000 | 0.000000 |
| 6 | 0.000000 | 0.000031 |
The output matrix \(C_s\) extracts the values of interest from the state vector (the vector of temperatures). In our case, the temperature of interest is the indoor temperature, \(\theta_6\):
which gives
# Output matrix
Cs = np.zeros((1, no_θ))
# output: last temperature node
Cs[:, -1] = 1
The feedthrough matrix \(D_s\) has one row (the number of outputs) and two columns, the number of inputs in vector \(u\), which is the same as the number of columns of matrix \(B_s\). In this case, \(D_s\) is composed entirely of zeros.
# Feedthrough (or feedforward) matrix
Ds = np.zeros(Bs.shape[1])
Eigenvalue analysis#
Time constants#
The eigenvalues \(\lambda_i\) of the state matrix \(A_s\) are related to the time constants \(\tau_i\):
λ = np.linalg.eig(As)[0]    # minimum eigenvalue of matrix As

np.set_printoptions(precision=1)
print('Time constants: \n', -1 / λ, 's \n')
Time constants:
 [  208.1   441.   1051.   1731.8 62794.2  4925.9  9141.6] s
The time step and the settling time are related to the time constants.
Time step#
The time step represents the amount of time that elapses between two consecutive calculations in a numerical integration method in numerical integration.
The stability condition for explicit Euler method requires that all eigenvalues \(\lambda _i \in \mathbb{Z}\) of the state matrix \(A_s\) satisfy the condition
If all eigenvalues of state matrix \(A_s\) are real, as is the case for thermal networks, then the above condition becomes:
where \(\Delta t\) is the time step.
Since the eigenvalues \(\lambda_i\) are related to the time constants \(\tau_i\),
it results that the condition for stability is
We choose as time step a value which is smaller than the maximum admited for numerical stability of Euler explicit method and is a multiple of 60 s.
# time step
Δt_max = min(-2 / λ)              # s
Δt = np.floor(Δt_max / 60) * 60   # s

print(f'Max time step Δt = {Δt_max:.2f} s')
print(f'Δt = {Δt} s')
Max time step Δt = 416.11 s
Δt = 360.0 s
Note: Applying an explicit Forward-Time Centered-Space (FTCS) discretization to the heat equation \(\frac{\partial \theta}{\partial t}=\alpha \frac{\partial ^2 \theta }{\partial x^2}\), where \(\alpha = \frac{\lambda }{\rho c}\), results in an algebraic update formula for each node. This relationship is characterized by the dimensionless grid Fourier number, defined as \(Fo = \alpha \Delta t / \Delta x^2\). Numerical stability is ensured by the Courant-Friedrichs-Lewy (CFL) condition, which imposes a strict upper limit of \(Fo \leq 0.5\) to mitigate the growth of errors (R. Courant et al., 1967). When simulating highly resistive insulation layers, the need for fine spatial resolution (requiring very small \(\Delta x\) to avoid numerical diffusion) forces prohibitively small time steps under the CFL stability condition. To circumvent this limitation, standard simulation engines rely exclusively on unconditionally stable implicit schemes, such as Crank-Nicolson or Backward Euler.
Settling time#
The settling time is the duration required for a dynamic system output to reach and remain within a specified error band around its final steady-state value after a disturbance or input change.
The settling time is about four times the largest time constant plus dead time (N. Nise, 2015, p. 163).
# settling time
t_settle = 4 * max(-1 / λ)
print(f'Settling time: {t_settle:.2f} s = {t_settle / 3600:.2f} h')
Settling time: 251176.86 s = 69.77 h
Simulation#
We will study the dynamic response of the model to:
step variation of a source (outdoor temperature \(T_o\) or indoor flow \(\dot{Q}_h\)),
variation of outdoor temperature given by weather data,
by using explicit and implicit Euler methods for time integration.
Step response#
Outdoor temperature#
The step response is the time evolution of the output(s) when the input is a step function. Usually, the zero initial conditions are considered. Mathematically, zero initial conditions means that the system variables and their derivatives are set to zero at the starting time; physically, it means that the system is at rest and there is no accumulation of energy in the capacities.
The number of time steps (i.e. the duration of simulation) depends on the settling time and the time step.
# number of time steps
n = int(np.ceil(t_settle / Δt))
# time vector
t = np.arange(0, n * Δt, Δt)
pd.DataFrame(t, columns=['time'])
| time | |
|---|---|
| 0 | 0.0 |
| 1 | 360.0 |
| 2 | 720.0 |
| 3 | 1080.0 |
| 4 | 1440.0 |
| ... | ... |
| 693 | 249480.0 |
| 694 | 249840.0 |
| 695 | 250200.0 |
| 696 | 250560.0 |
| 697 | 250920.0 |
698 rows × 1 columns
Let’s assume that the outdoor temperature \(T_o\) has a step variation of 1°C (the indoor heat flow is zero, \(\dot{Q}_h = 0\)).
The input vector is formed by the vector of outdoor temperature and the vector of indoor heat-flow rate.
u = np.block([[np.ones([1, n])],    # To = [1, 1, ... , 1]
              [np.zeros([1, n])]])  # Qh = [0, 0, ... , 0]
pd.DataFrame(u)
| 0 | 1 | 2 | 3 | 4 | 5 | 6 | 7 | 8 | 9 | ... | 688 | 689 | 690 | 691 | 692 | 693 | 694 | 695 | 696 | 697 | |
|---|---|---|---|---|---|---|---|---|---|---|---|---|---|---|---|---|---|---|---|---|---|
| 0 | 1.0 | 1.0 | 1.0 | 1.0 | 1.0 | 1.0 | 1.0 | 1.0 | 1.0 | 1.0 | ... | 1.0 | 1.0 | 1.0 | 1.0 | 1.0 | 1.0 | 1.0 | 1.0 | 1.0 | 1.0 |
| 1 | 0.0 | 0.0 | 0.0 | 0.0 | 0.0 | 0.0 | 0.0 | 0.0 | 0.0 | 0.0 | ... | 0.0 | 0.0 | 0.0 | 0.0 | 0.0 | 0.0 | 0.0 | 0.0 | 0.0 | 0.0 |
2 rows × 698 columns
Let’s assume zero initial conditions for the temperature vector (i.e., all temperatures and their derivatives are zero) for explicit and implicit Euler integration methods.
# initial values for temperatures obtained by explicit and implicit Euler
θ_exp = np.zeros([no_θ, t.shape[0]])
θ_imp = np.zeros([no_θ, t.shape[0]])
The formula for Euler forward (or explicit) integration is:
For Euler backward (or implicit) integration it is:
# time integration: Euler explicit & implicit
for k in range(t.shape[0] - 1):
    θ_exp[:, k + 1] = (np.eye(no_θ) + Δt * As) @\
        θ_exp[:, k] + Δt * Bs @ u[:, k]
    θ_imp[:, k + 1] = np.linalg.inv(np.eye(no_θ) - Δt * As) @\
        (θ_imp[:, k] + Δt * Bs @ u[:, k + 1])
# plot results
fig, ax = plt.subplots()
ax.plot(t / 3600, θ_exp[-1, :], t / 3600, θ_imp[-1, :])
ax.set(xlabel='Time, $t$ / h',
       ylabel='Air temperature, $θ$ / °C',
       title='Step input: $T_o$')
ax.legend(['Euler explicit', 'Euler implicit'])
plt.show()
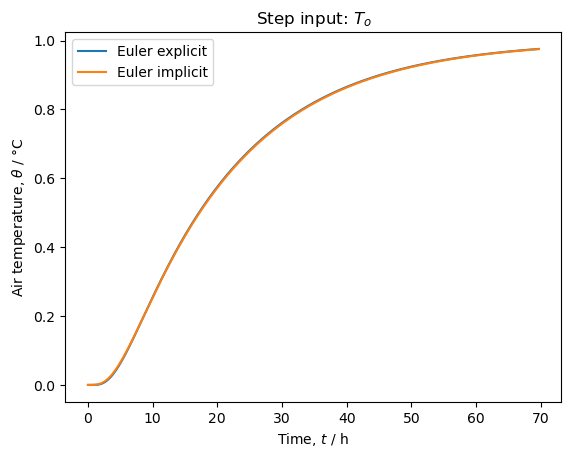
Figure 3. Step response to outdoor temperature \(T_o\) obtained by explicit and implicit Euler integration of the state-space model. For small time steps, the two solutions are practically identical.
Indoor heat flow rate#
Let’s consider that the indoor heat flow rate \(\dot{Q}_h\) has a step variation of 1 W (the outdoor temperature is zero, \(T_o = 0\)).
u = np.block([[np.zeros([1, n])],   # To = [0, 0, ... , 0]
              [np.ones([1, n])]])   # Qh = [1, 1, ... , 1]
pd.DataFrame(u)
| 0 | 1 | 2 | 3 | 4 | 5 | 6 | 7 | 8 | 9 | ... | 688 | 689 | 690 | 691 | 692 | 693 | 694 | 695 | 696 | 697 | |
|---|---|---|---|---|---|---|---|---|---|---|---|---|---|---|---|---|---|---|---|---|---|
| 0 | 0.0 | 0.0 | 0.0 | 0.0 | 0.0 | 0.0 | 0.0 | 0.0 | 0.0 | 0.0 | ... | 0.0 | 0.0 | 0.0 | 0.0 | 0.0 | 0.0 | 0.0 | 0.0 | 0.0 | 0.0 |
| 1 | 1.0 | 1.0 | 1.0 | 1.0 | 1.0 | 1.0 | 1.0 | 1.0 | 1.0 | 1.0 | ... | 1.0 | 1.0 | 1.0 | 1.0 | 1.0 | 1.0 | 1.0 | 1.0 | 1.0 | 1.0 |
2 rows × 698 columns
We initialize again to zero the temperature vector for explicit and implicit Euler.
θ_exp = np.zeros([no_θ, t.shape[0]])
θ_imp = np.zeros([no_θ, t.shape[0]])
The formula for Euler forward (or explicit) integration is
and for Euler backward (or implicit) integration it is
for k in range(t.shape[0] - 1):
    θ_exp[:, k + 1] = (np.eye(no_θ) + Δt * As) @\
        θ_exp[:, k] + Δt * Bs @ u[:, k]
    θ_imp[:, k + 1] = np.linalg.inv(np.eye(no_θ) - Δt * As) @\
        (θ_imp[:, k] + Δt * Bs @ u[:, k + 1])
fig, ax = plt.subplots()
ax.plot(t / 3600, θ_exp[-1, :], t / 3600, θ_imp[-1, :])
ax.set(xlabel='Time, $t$ / h',
       ylabel='Air temperature, $θ$ / °C',
       title='Step input: $Q_h$')
ax.legend(['Explicit', 'Implicit'])
plt.show()
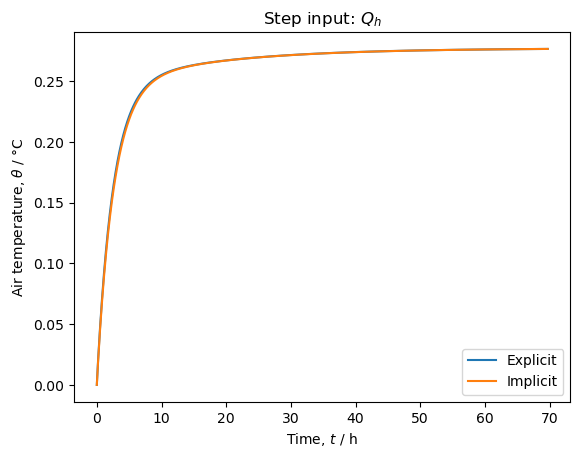
Figure 4. Step response to indoor heat flow rate \(\dot{Q}_h\) obtained by explicit and implicit Euler integration of the state-space model.
Simulation with outdoor temperature from weather data#
Input data set#
Outdoor temperature#
We want to use the weather data for Lyon from start_dateto end_date.
start_date = '2000-04-10'
end_date = '2000-05-15'
filename = '../weather_data/FRA_Lyon.074810_IWEC.epw'
From the weather data, only the air temperature is kept.
[data, meta] = dm4bem.read_epw(filename, coerce_year=None)
# weather = data[["temp_air", "dir_n_rad", "dif_h_rad"]]
weather = data[["temp_air"]]
del data
In the weather data file, each month is taken from another year. We will replace the years with only one value, e.g. 2000, then keep only the values between start_date and end_date.
weather.index = weather.index.map(lambda t: t.replace(year=2000))
weather = weather.loc[start_date:end_date]
pd.DataFrame(weather)
| temp_air | |
|---|---|
| 2000-04-10 00:00:00+01:00 | 5.1 |
| 2000-04-10 01:00:00+01:00 | 4.5 |
| 2000-04-10 02:00:00+01:00 | 3.8 |
| 2000-04-10 03:00:00+01:00 | 3.2 |
| 2000-04-10 04:00:00+01:00 | 3.1 |
| ... | ... |
| 2000-05-15 19:00:00+01:00 | 14.0 |
| 2000-05-15 20:00:00+01:00 | 14.0 |
| 2000-05-15 21:00:00+01:00 | 12.6 |
| 2000-05-15 22:00:00+01:00 | 12.0 |
| 2000-05-15 23:00:00+01:00 | 12.0 |
864 rows × 1 columns
# time vector for weather data at 1 h time step
tw = np.arange(0, 3600 * weather.shape[0], 3600)
pd.DataFrame(tw)
| 0 | |
|---|---|
| 0 | 0 |
| 1 | 3600 |
| 2 | 7200 |
| 3 | 10800 |
| 4 | 14400 |
| ... | ... |
| 859 | 3092400 |
| 860 | 3096000 |
| 861 | 3099600 |
| 862 | 3103200 |
| 863 | 3106800 |
864 rows × 1 columns
Resampled outdoor temperature#
The time vector for simulation is at time step \(\Delta t\).
# time vector for simulation
t = np.arange(0, 3600 * weather.shape[0], Δt)
The outdoor temperature \(T_o\) (which is at a time step of \(1 \, \mathrm{hour} = 3600 \, \mathrm{s}\)) needs to be re-sampled at a time step equal to \(\Delta t\).
# resample outdoor temperature To at timestep Δt
To = np.interp(t, tw, weather['temp_air'])
pd.DataFrame(To, index=t, columns=['θ °C'])
| θ °C | |
|---|---|
| 0.0 | 5.10 |
| 360.0 | 5.04 |
| 720.0 | 4.98 |
| 1080.0 | 4.92 |
| 1440.0 | 4.86 |
| ... | ... |
| 3108600.0 | 12.00 |
| 3108960.0 | 12.00 |
| 3109320.0 | 12.00 |
| 3109680.0 | 12.00 |
| 3110040.0 | 12.00 |
8640 rows × 1 columns
Indoor heat flow rate#
Let’s consider that the indoor heat flow \(\dot{Q}_h\) is zero.
Qh = np.zeros(To.shape[0])
Input vector#
The input vector \(u\) is formed as a block vector from outdoor temperature \(T_o\) and indoor heat flow \(\dot{Q}_h\):
# input vector [To, Qh]
u = np.block([[To], [Qh]])
pd.DataFrame(u, index=['To', 'Qh'])
| 0 | 1 | 2 | 3 | 4 | 5 | 6 | 7 | 8 | 9 | ... | 8630 | 8631 | 8632 | 8633 | 8634 | 8635 | 8636 | 8637 | 8638 | 8639 | |
|---|---|---|---|---|---|---|---|---|---|---|---|---|---|---|---|---|---|---|---|---|---|
| To | 5.1 | 5.04 | 4.98 | 4.92 | 4.86 | 4.8 | 4.74 | 4.68 | 4.62 | 4.56 | ... | 12.0 | 12.0 | 12.0 | 12.0 | 12.0 | 12.0 | 12.0 | 12.0 | 12.0 | 12.0 |
| Qh | 0.0 | 0.00 | 0.00 | 0.00 | 0.00 | 0.0 | 0.00 | 0.00 | 0.00 | 0.00 | ... | 0.0 | 0.0 | 0.0 | 0.0 | 0.0 | 0.0 | 0.0 | 0.0 | 0.0 | 0.0 |
2 rows × 8640 columns
Time integration#
The responses are obtained by initializing the temperature vectors for explicit and implicit Euler and by integrating in time.
θ0 = 15     # °C, initial values for temperatures
θ_exp = θ0 * np.ones([no_θ, t.shape[0]])
θ_imp = θ0 * np.ones([no_θ, t.shape[0]])
for k in range(u.shape[1] - 1):
    θ_exp[:, k + 1] = (np.eye(no_θ) + Δt * As) @\
        θ_exp[:, k] + Δt * Bs @ u[:, k]
    θ_imp[:, k + 1] = np.linalg.inv(np.eye(no_θ) - Δt * As) @\
        (θ_imp[:, k] + Δt * Bs @ u[:, k + 1])
Plots of results#
fig, ax = plt.subplots()
ax.plot(t / 3600 / 24, To, label='Outdoor temperature')
ax.plot(t / 3600 / 24, θ_exp[-1, :], label='Indoor temperature')
ax.set(xlabel='Time, $t$ / day',
       ylabel='Air temperature, $θ$ / °C',
       title='Explicit Euler')
ax.legend()
plt.show()
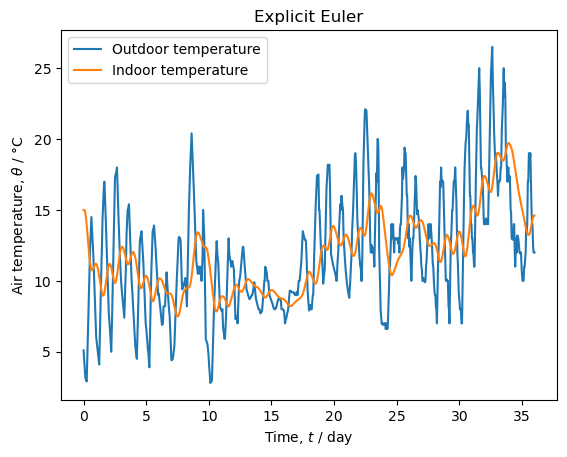
Figure 5. Simulation of wall response to the variation of the outdoor temperature obtained with Euler explicit method for integration in time.
fig, ax = plt.subplots()
ax.plot(t / 3600 / 24, To, label='Outdoor temperature')
ax.plot(t / 3600 / 24, θ_imp[-1, :], label='Indoor temperature')
ax.set(xlabel='Time, $t$ / day',
       ylabel='Air temperature, $θ$ / °C',
       title='Implicit Euler')
ax.legend()
plt.show()

Figure 6. Simulation of wall response to the variation of the outdoor temperature obtained with Euler implicit method for integration in time.
Simulation by using Pandas#
Let’s consider the same code as in the previous sections, with the difference that Pandas are used for plotting the results of the simulations.
# Simulation with outdoor temperature from weather data with Pandas
# -----------------------------------------------------------------
start_date = '2000-04-10'
end_date = '2000-05-15'

# read data and keep air temperature
filename = '../weather_data/FRA_Lyon.074810_IWEC.epw'
[data, meta] = dm4bem.read_epw(filename, coerce_year=None)
weather = data[["temp_air"]].copy()
del data

# replace years with year 2000 and select time interval
weather.index = weather.index.map(lambda t: t.replace(year=2000))
weather = weather.loc[start_date:end_date]

# resample weather data
data = weather['temp_air']
data = data.resample(str(Δt) + 's').interpolate(method='linear')
data = data.rename('To').to_frame()

# indoor auxiliary heat
data['Qa'] = 0 * np.ones(data.shape[0])

# input vector
u = data[['To', 'Qa']]

# initial conditions
θ_exp = θ0 * np.ones([As.shape[0], u.shape[0]])
θ_imp = θ0 * np.ones([As.shape[0], u.shape[0]])

# time integration: Euler explicit & implicit
n_states = As.shape[0]
I = np.eye(n_states)

for k in range(u.shape[0] - 1):
    θ_exp[:, k + 1] = (I + Δt * As) @ θ_exp[:, k]\
        + Δt * Bs @ u.iloc[k, :]
    θ_imp[:, k + 1] = np.linalg.inv(I - Δt * As) @\
        (θ_imp[:, k] + Δt * Bs @ u.iloc[k, :])

data['θi_exp'] = θ_exp[-1, :]
data['θi_imp'] = θ_imp[-1, :]

ax = data[['To', 'θi_exp']].plot()
ax.legend(['Outdoor temperature', 'Indoor temperature'])
ax.set(xlabel='Time',
       ylabel='Air temperature, $θ$ / °C',
       title='Explicit Euler')
plt.show()
---------------------------------------------------------------------------
ValueError                                Traceback (most recent call last)
File offsets.pyx:4548, in pandas._libs.tslibs.offsets.to_offset()

ValueError: invalid literal for int() with base 10: '360.0'

The above exception was the direct cause of the following exception:

ValueError                                Traceback (most recent call last)
Cell In[46], line 18
     16 # resample weather data
     17 data = weather['temp_air']
---> 18 data = data.resample(str(Δt) + 's').interpolate(method='linear')
     19 data = data.rename('To').to_frame()
     21 # indoor auxiliary heat

File ~/opt/anaconda3/lib/python3.11/site-packages/pandas/core/generic.py:9439, in NDFrame.resample(self, rule, axis, closed, label, convention, kind, on, level, origin, offset, group_keys)
   9436 else:
   9437     axis = 0
-> 9439 return get_resampler(
   9440     cast("Series | DataFrame", self),
   9441     freq=rule,
   9442     label=label,
   9443     closed=closed,
   9444     axis=axis,
   9445     kind=kind,
   9446     convention=convention,
   9447     key=on,
   9448     level=level,
   9449     origin=origin,
   9450     offset=offset,
   9451     group_keys=group_keys,
   9452 )

File ~/opt/anaconda3/lib/python3.11/site-packages/pandas/core/resample.py:1969, in get_resampler(obj, kind, **kwds)
   1965 def get_resampler(obj: Series | DataFrame, kind=None, **kwds) -> Resampler:
   1966     """
   1967     Create a TimeGrouper and return our resampler.
   1968     """
-> 1969     tg = TimeGrouper(**kwds)
   1970     return tg._get_resampler(obj, kind=kind)

File ~/opt/anaconda3/lib/python3.11/site-packages/pandas/core/resample.py:2046, in TimeGrouper.__init__(self, freq, closed, label, how, axis, fill_method, limit, kind, convention, origin, offset, group_keys, **kwargs)
   2043 if convention not in {None, "start", "end", "e", "s"}:
   2044     raise ValueError(f"Unsupported value {convention} for `convention`")
-> 2046 freq = to_offset(freq)
   2048 end_types = {"M", "A", "Q", "BM", "BA", "BQ", "W"}
   2049 rule = freq.rule_code

File offsets.pyx:4460, in pandas._libs.tslibs.offsets.to_offset()

File offsets.pyx:4557, in pandas._libs.tslibs.offsets.to_offset()

ValueError: Invalid frequency: 360.0s
Figure 7. Simulation of wall response to the variation of the outdoor temperature obtained with Euler explicit method for integration in time.
ax = data[['To', 'θi_imp']].plot()
ax.legend(['Outdoor temperature', 'Indoor temperature'])
ax.set(xlabel='Time',
       ylabel='Air temperature, $θ$ / °C',
       title='Implicit Euler')
plt.show()
Figure 8. Simulation of wall response to the variation of the outdoor temperature obtained with Euler implicit method for integration in time.
Discussion#
Change the time step to do it slightly larger than the maximum time step. Compare the results obtained with Euler explicit and Euler implicit methods.
Interchange the materials of the layers so that layer 1 to be insulation and layer 2 to be concrete. Discuss the step responses and the simulation for weather. Give arguments for the advantages and the disadvantages of indoor and outdoor insulation. Explain the difference in the maximum time step for numerical integration.
References#
Ghiaus, C. (2013). Causality issue in the heat balance method for calculating the design heating and cooling loads, Energy 50: 292-301, HAL 03605823
C. Ghiaus (2021). Dynamic Models for Energy Control of Smart Homes, in S. Ploix M. Amayri, N. Bouguila (eds.) Towards Energy Smart Homes, Online ISBN: 978-3-030-76477-7, Print ISBN: 978-3-030-76476-0, Springer, pp. 163-198 HAL 03578578
N. Nise (2015). Control systems engineering, 7th ed., John Wiley & Sons. §4.2 First order systems
R. Courant, K. Friedrichs, H. Lewy (1967) On the partial difference equations of mathematical physics. IBM Journal of Research and Development. 1967;11(2):215–234. English translation of the original 1928 German paper.